THE LANGELIER INDEX AS A PREDICTOR OF LCR RESULTS
The Langelier Index is a measure of the departure of a water sample from equilibrium with solid CaCO3 as calcite:
LI = pHmeasured - pHequilibrium
| Langelier Index | Scale Formation Potential |
| <-0.5 | scale dissolving |
| - 0.5 to +0.5 | neutral |
| > 0.5 | scale depositing |
Strictly speaking, these calculations only apply to CaCO3 scales, but this index has often been regarded as generally indicative of corrosion potential. The Langelier Index is a perfectly good measure of the potential for corrosion (or for scaling) of calcite in distribution systems. Its usefulness as a general indicator of corrosion potential however is open to question. There is no mechnism connecting the behavior of calcite to that of other scale minerals other than possibly for carbonates of lead and copper.
So, we have two issues:
(1) how useful is the LI as a general indicator of corrosion? Evaluated here.
(2) if not, is it useful for predicting the behavior of other carbonate minerals besides calcite? l See the Langelier Index and Pb and Cu Carbonates.
THE LANGELIER INDEX AND LCR TEST RESULTS
A water quality dataset for 23 representative US water utilities, some with multiple years, enables us to test both of these propositions. As part of required testing under the Lead and Copper Rule, all utilities report 90th percentile Pb and Cu values on a regular basis, and we can regard these numbers as a measure of the amount of corrosion experienced in the premise and service line portions of the distribution system. Then comparing these values to corrosion indices for the same year provides a measure of the usefulness of those indices as predictors of corrosion.

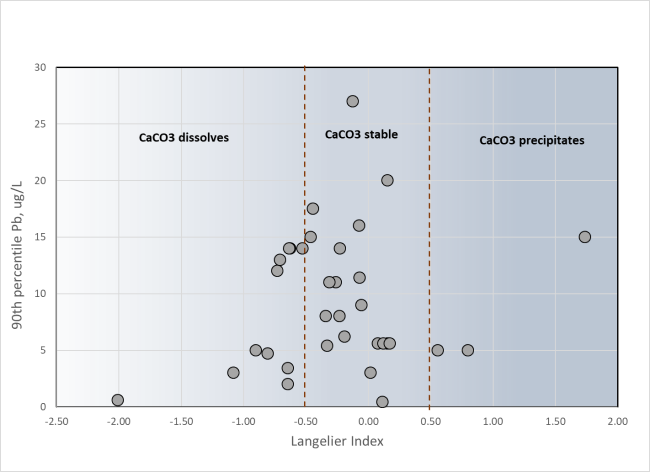
LCR sampling results for Pb v Langelier Index for 23 representative US utilities (larger image)
For Pb, we see that there is no statistical correlation of 90th percentile Pb values with the Langelier Index. However note that nearly all sampling rounds with elevated Pb (> 10 ug/L) were associated with negative LI values. That still leaves a large number with negative LI and low Pb, so the LI could be regarded as an indicator of a potential for elevated Pb, bearing in mind that a majority of low Pb sampling rounds will also have negative LI values.

LCR sampling results for Cu v Langelier Index for 23 representative US utilities (larger image)
Copper shows a similar pattern to lead: elevated values are associated with a negative Langelier Index, but so are many low-Cu sampling results. We do see that all instances of positive Langelier Index are associaated with low Cu.